Most sales teams have an ideal customer profile. Very few have a good one. The typical ICP is a vague description cobbled together from gut feeling and a few closed deals: something like mid-market SaaS companies with 50-200 employees. That is not a profile. That is a guess.
A real ICP is built on data. Firmographic data, technographic data, behavioral signals, and enriched contact intelligence. When you combine these layers, you stop guessing which accounts to target and start knowing.
This guide walks through the exact framework for building an ICP using enriched data, how to score accounts against it, and how to keep it sharp as your market evolves.
Why Most ICPs Fail
The biggest problem with traditional ICPs is survivorship bias. Teams look at their current customers and reverse-engineer a profile. But that only tells you who said yes. It does not tell you who would have said yes if you had found them, or who said yes but turned out to be a terrible fit.
A data-driven ICP fixes this by looking at patterns across your entire pipeline, not just closed-won deals. It factors in deal velocity, customer lifetime value, churn rates, and expansion revenue. The result is a profile that predicts not just who will buy, but who will stay and grow.
Companies using persona-based segmentation see 2-5x higher email click-through rates. That is not a small improvement. That is the difference between a campaign that works and one that gets ignored.
The Three Data Pillars of a Strong ICP
Pillar 1: Firmographic Data
Firmographic data describes the company itself. Think of it as the demographic data of the B2B world. The core attributes you need:
- Employee count (not just a range, but ideally the actual number)
- Annual revenue
- Industry classification (NAICS or SIC codes)
- Geographic headquarters and office locations
- Ownership structure (public, private, PE-backed, VC-funded)
- Growth trajectory (hiring velocity, revenue growth rate)
This is the first filter. If you sell enterprise software starting at $50K/year, companies with 10 employees are probably not your market. Firmographic data lets you eliminate the obvious misfits quickly.
The catch: firmographic data needs to be current. Company sizes change, revenue shifts, industries evolve. Data enrichment platforms should refresh firmographic data at minimum weekly. Stale firmographics lead to wasted outreach on companies that have outgrown or shrunk past your sweet spot.
Pillar 2: Technographic Data
Technographic data reveals what technology a company uses. This is incredibly powerful for competitive displacement and timing your outreach.
The categories that matter most:
- CRM system (Salesforce, HubSpot, Pipedrive, Zoho)
- Marketing automation (Marketo, Pardot, Mailchimp, ActiveCampaign)
- Cloud infrastructure (AWS, Azure, GCP)
- Development tools and frameworks
- Analytics and BI platforms
- Communication tools (Slack, Teams, Zoom)
Why this matters: if you sell a CRM migration service, knowing which companies currently run Salesforce Classic (vs. Lightning) tells you exactly who is ripe for an upgrade conversation. If you sell a marketing automation tool, knowing whose Marketo contract renews in Q3 gives you a 6-month runway to build the relationship.
Technographic data combined with intent data is where account-based marketing gets really precise. You can identify companies that use a competitor product AND are actively researching alternatives.
Pillar 3: Behavioral and Intent Data
This is the layer most teams skip, and it is often the most valuable. Intent data tells you what companies are actively researching and considering right now.
There are three types:
- First-party intent: actions on your own website (pages visited, content downloaded, pricing page views)
- Second-party intent: signals from partner platforms (G2 comparisons, LinkedIn engagement, review site activity)
- Third-party intent: aggregated research behavior across thousands of publisher websites (Bombora tracks 12,000+ topics across 5,000+ publisher sites)
Intent data identifies accounts 6-9 months before they contact vendors directly. That is your window to be the first conversation they have, not the fifth.
Building the ICP: Step by Step
Step 1: Analyze Your Best Customers
Pull data on your top 20% of customers by lifetime value, not just revenue. Include factors like:
- Time to close (faster is better)
- Customer lifetime value
- Net revenue retention (expansion minus churn)
- Support ticket volume (lower is better)
- NPS or satisfaction scores
Enrich these accounts with firmographic and technographic data if you do not already have it. Look for patterns. Do your best customers cluster around specific industries, company sizes, tech stacks, or growth stages?
Step 2: Analyze Your Worst Customers
This step gets skipped all the time, and it should not be. Look at churned customers, long sales cycles that went nowhere, and deals with heavy discounting. What patterns emerge?
Maybe you consistently struggle with companies under 20 employees. Maybe certain industries have high churn. Maybe companies using a specific tech stack always stall in evaluation. These are your anti-ICP signals, and they are just as valuable as your positive indicators.
Step 3: Score the Attributes
Not all attributes matter equally. Assign weights based on how strongly each attribute correlates with success. A simple approach:
- Strong positive signal: +3 points (e.g., specific industry, 100-500 employees)
- Moderate positive signal: +2 points (e.g., VC-funded, uses compatible tech)
- Weak positive signal: +1 point (e.g., headquartered in target geography)
- Negative signal: -2 points (e.g., uses competitor with long contract)
- Disqualifying signal: remove from list (e.g., wrong industry entirely)
The scoring model turns your ICP from a description into a number. Accounts scoring 8+ are your Tier 1 targets. Accounts scoring 5-7 are Tier 2. Below 5, do not bother.
Step 4: Enrich and Validate
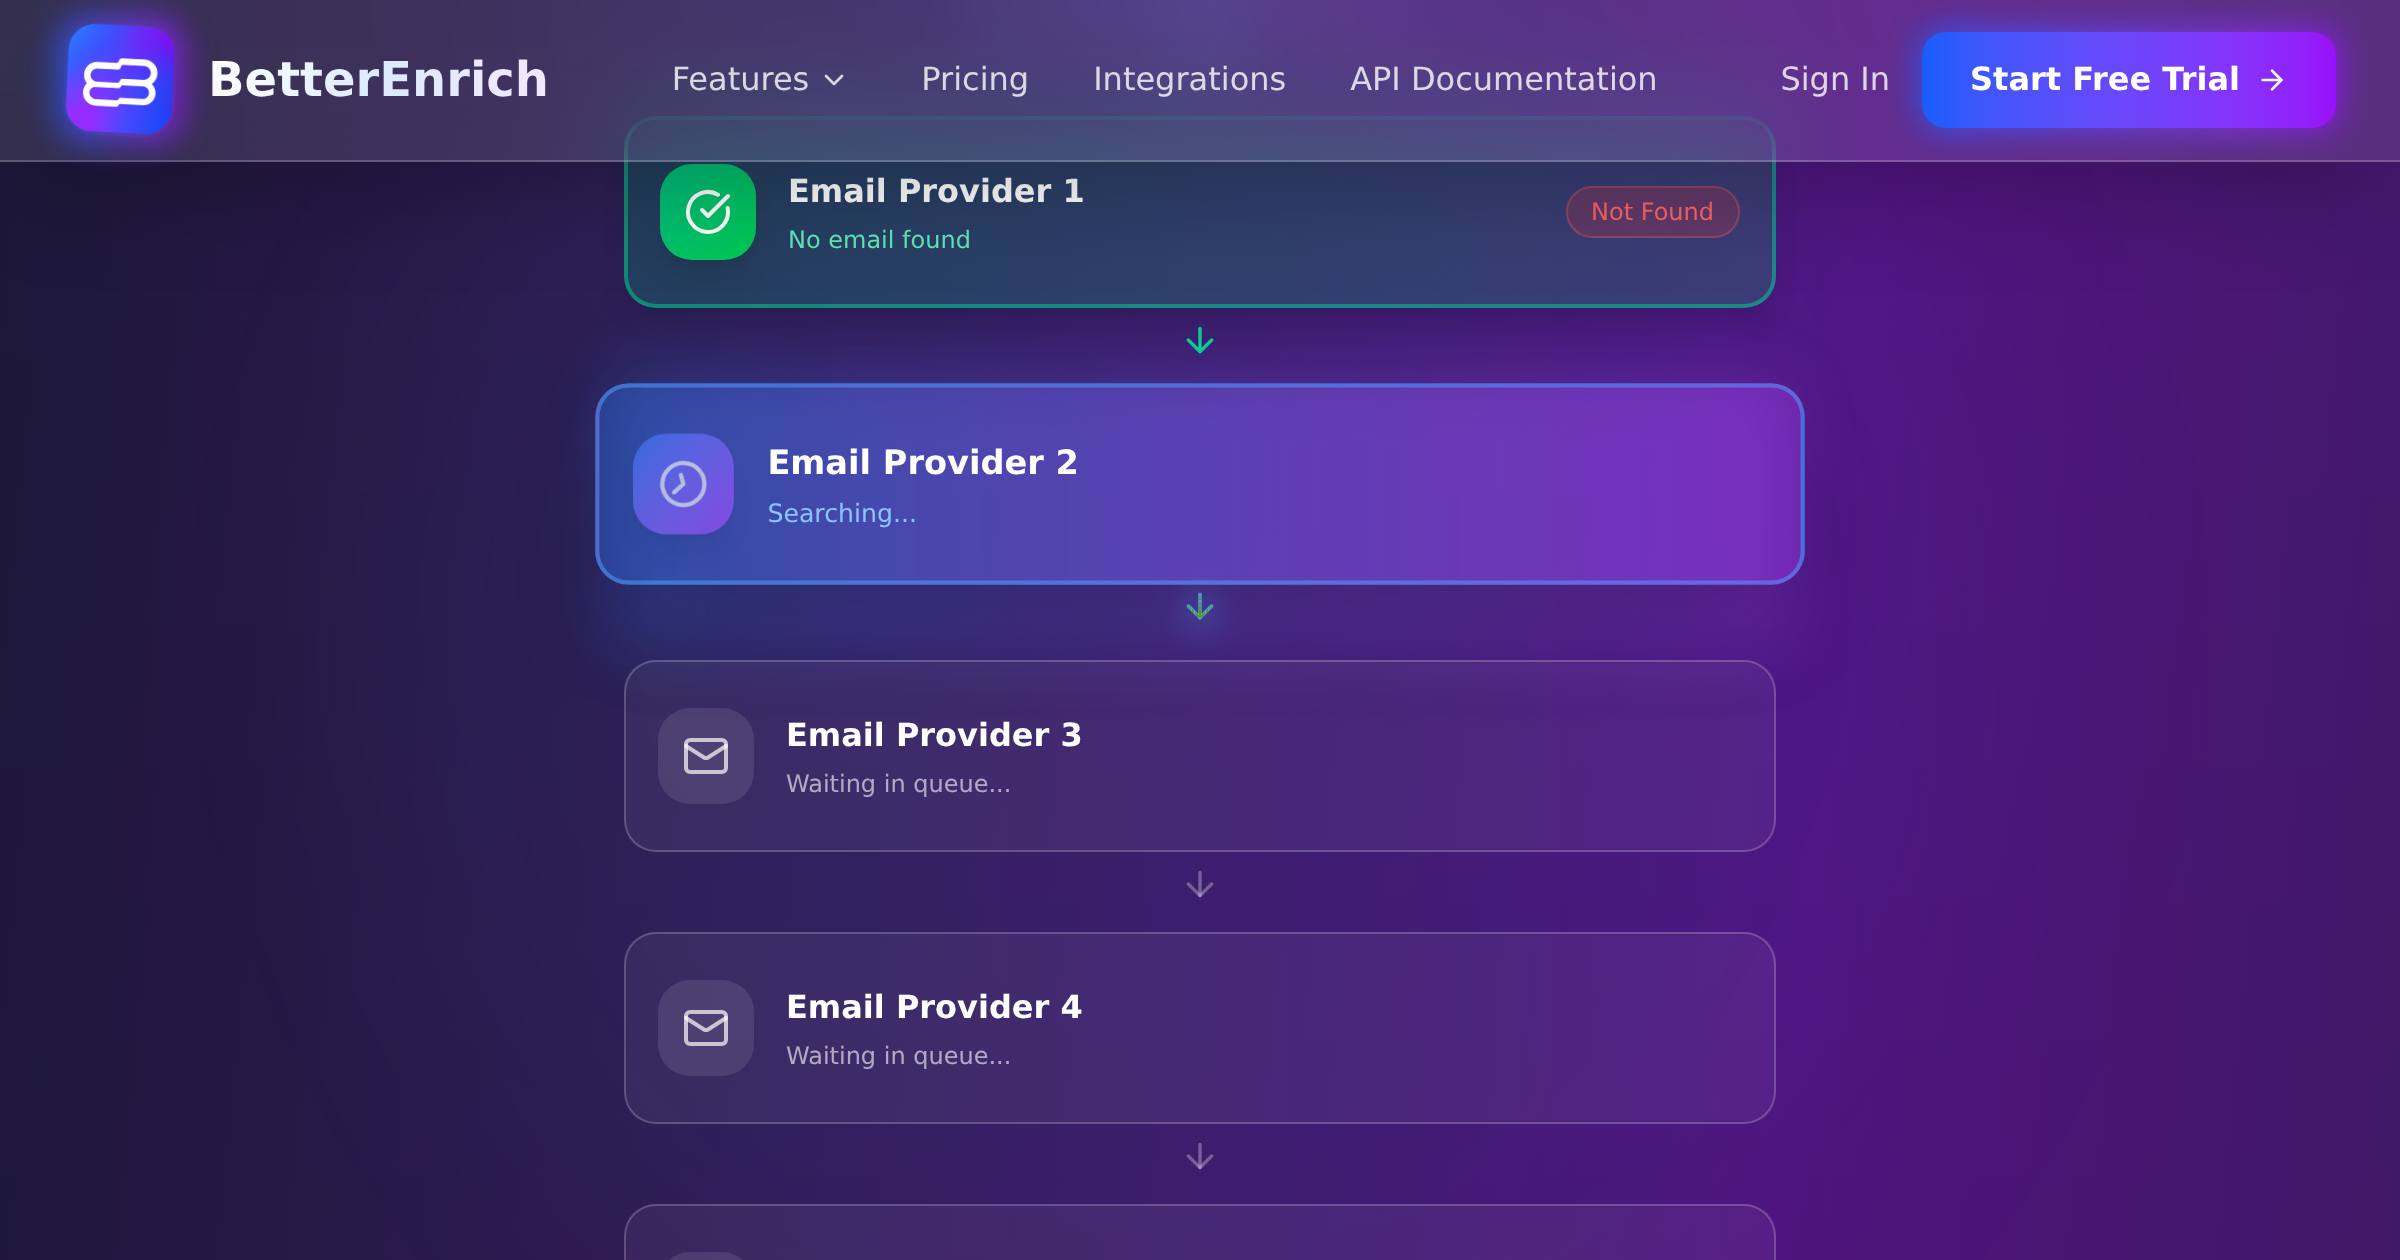
Run your ICP criteria against a fresh dataset. Use waterfall enrichment to pull firmographic, technographic, and contact data for companies matching your profile. This is where BetterEnrich shines: the 85-95% coverage rate from waterfall enrichment means you are finding nearly every company that fits, not just the ones your single-source tool happens to have.
Validate the model by comparing your scored list against recent pipeline data. Do high-scoring accounts actually convert faster? Do low-scoring ones stall? Adjust weights based on real outcomes.
Step 5: Layer in Intent Data
Your scored list tells you who to target. Intent data tells you when. An account scoring 9/10 on fit but showing zero intent signals should go into a nurture sequence, not a cold call blitz. An account scoring 7/10 on fit but actively researching your category should jump to the front of the queue.
The combination of fit score plus intent score is what separates good targeting from great targeting. Lead enrichment drives 25% higher conversion rates and 15% lower customer acquisition costs when the enrichment data is actually used for targeting decisions.
Keeping Your ICP Sharp
An ICP is not a set-it-and-forget-it exercise. Markets change, your product evolves, and new segments emerge. Review your ICP quarterly:
- Pull fresh win/loss data and check if the patterns still hold
- Re-enrich your customer base to catch firmographic changes
- Monitor which ICP segments have the highest conversion rates
- Look for emerging segments you might be missing
B2B contact data decays at 2.1% per month. Job title changes affect 65.8% of contacts within 12 months. If your ICP was built on data from a year ago and never refreshed, it is operating on assumptions that may no longer hold.
Common ICP Mistakes
Making it too broad. If your ICP describes half the companies in the country, it is not useful. Narrow it down until you can realistically list the number of total addressable accounts.
Making it too narrow. On the flip side, if your ICP describes 200 companies total, you might not have a big enough market. Find the balance.
Ignoring negative signals. The accounts you should NOT target are as important as the ones you should. Build explicit exclusion criteria into your ICP.
Not using enrichment data. Gut-feel ICPs are worse than useless because they create false confidence. Use actual data to validate every assumption.
Not updating it. Quarterly reviews are the minimum. If you notice a sudden shift in win rates or deal velocity, investigate immediately.
From ICP to Action
Your ICP should directly feed three things:
- Your target account list (enriched with contact data for outreach)
- Your lead scoring model (so inbound leads get routed correctly)
- Your messaging framework (so outreach resonates with the specific pain points of your ICP)
When your ICP is data-driven and enrichment-powered, every downstream sales and marketing activity gets more efficient. Your reps stop wasting time on accounts that will never close. Your campaigns reach the right people with the right message. And your pipeline fills with opportunities that actually convert.
That is the real value of combining enriched data with a disciplined ICP process. Not just knowing who your customer is, but proving it with data and acting on it at scale.