Your sales team is drowning in leads. Some are worth dropping everything to call. Others will never buy no matter how many emails you send. The problem is telling them apart before you waste hours on the wrong ones.
Lead scoring solves this. It assigns a numerical value to each lead based on how closely they match your ideal customer and how actively they are engaging with your brand. The higher the score, the more likely they are to convert. Simple concept, but most teams get the execution wrong.
The typical lead scoring model uses basic demographic data and website activity. That is a start, but it misses the richest signals. When you layer in enriched data, firmographic intelligence, technographic signals, and intent behavior, your scoring model goes from rough estimate to precision instrument.
Why Basic Lead Scoring Falls Short
Most CRMs come with basic lead scoring out of the box. You assign points for form fills, email opens, page visits, and maybe job title. The problem is these signals are shallow.
Someone who opens three emails might be interested. Or they might be an intern doing competitive research. A director-level title sounds good, but a Director of Facilities at a 10-person company is not the same buying power as a Director of Revenue Operations at a 500-person company.
Without enrichment data, you are scoring leads based on what they tell you (form fills) and what they do on your site (behavior). You are missing what they are (firmographic fit), what tools they use (technographic fit), and what they are researching elsewhere (intent signals).
The Two Dimensions of Lead Scoring
Fit Score: How Well They Match Your ICP
The fit score measures whether a lead looks like your ideal customer. This is entirely driven by enriched data:
- Company size: Does the company fall within your target employee range?
- Revenue: Can they afford your product?
- Industry: Is it a vertical where you have strong product-market fit?
- Technology stack: Are they using tools that integrate with or complement yours?
- Geography: Are they in a region you serve?
- Seniority level: Are they senior enough to influence or make purchasing decisions?
Each attribute gets a point value based on how strongly it correlates with closed-won deals. A company with 200 employees in SaaS might score +10 for size and +10 for industry. A company with 5 employees in agriculture might score +1 for size and 0 for industry.
Intent Score: How Actively They Are Engaging
The intent score measures buying behavior. This combines first-party engagement with third-party intent signals:
- Website visits: pricing page (+5), product page (+3), blog (+1)
- Content downloads: whitepaper (+4), case study (+5), ROI calculator (+6)
- Email engagement: opens (+1), clicks (+2), replies (+5)
- Third-party intent: researching your category on publisher sites (+8)
- Review site activity: comparing products on G2 or Capterra (+7)
- Direct outreach: demo request (+10), meeting scheduled (+15)
Building the Model Step by Step
Step 1: Analyze Historical Wins
Pull your closed-won deals from the past 12 months. For each one, enrich the account with firmographic and technographic data if you have not already. Look for patterns: what company sizes convert? What industries? What tech stacks?
Do the same for closed-lost deals and stalled opportunities. You want to understand what separates the winners from the losers.
Step 2: Define Your Scoring Criteria
Based on your analysis, define the attributes that matter and assign point values. Start simple. A model with 8-10 attributes is better than one with 30 that nobody understands.
Example scoring model:
- Company size 50-500 employees: +10
- Company size 501-2000: +7
- Company size under 50: +2
- SaaS industry: +8
- Technology/IT services: +6
- Uses Salesforce or HubSpot: +5
- Uses competitor product: +7
- Director+ title: +6
- Manager title: +3
- Pricing page visit: +5
- Demo request: +15
- Third-party intent signal: +8
Step 3: Set Thresholds
Define what each score range means for routing:
- Score 25+: Hot lead. Route to rep immediately. SLA: contact within 1 hour.
- Score 15-24: Warm lead. Add to priority outreach sequence. Contact within 24 hours.
- Score 8-14: Nurture lead. Add to automated nurture sequence. Monthly check-in.
- Score under 8: Monitor only. Do not spend rep time. Automated content only.
Step 4: Enrich Every Lead
Your scoring model only works if you have the data to score against. Every lead that enters your system should be automatically enriched with firmographic, technographic, and contact data.
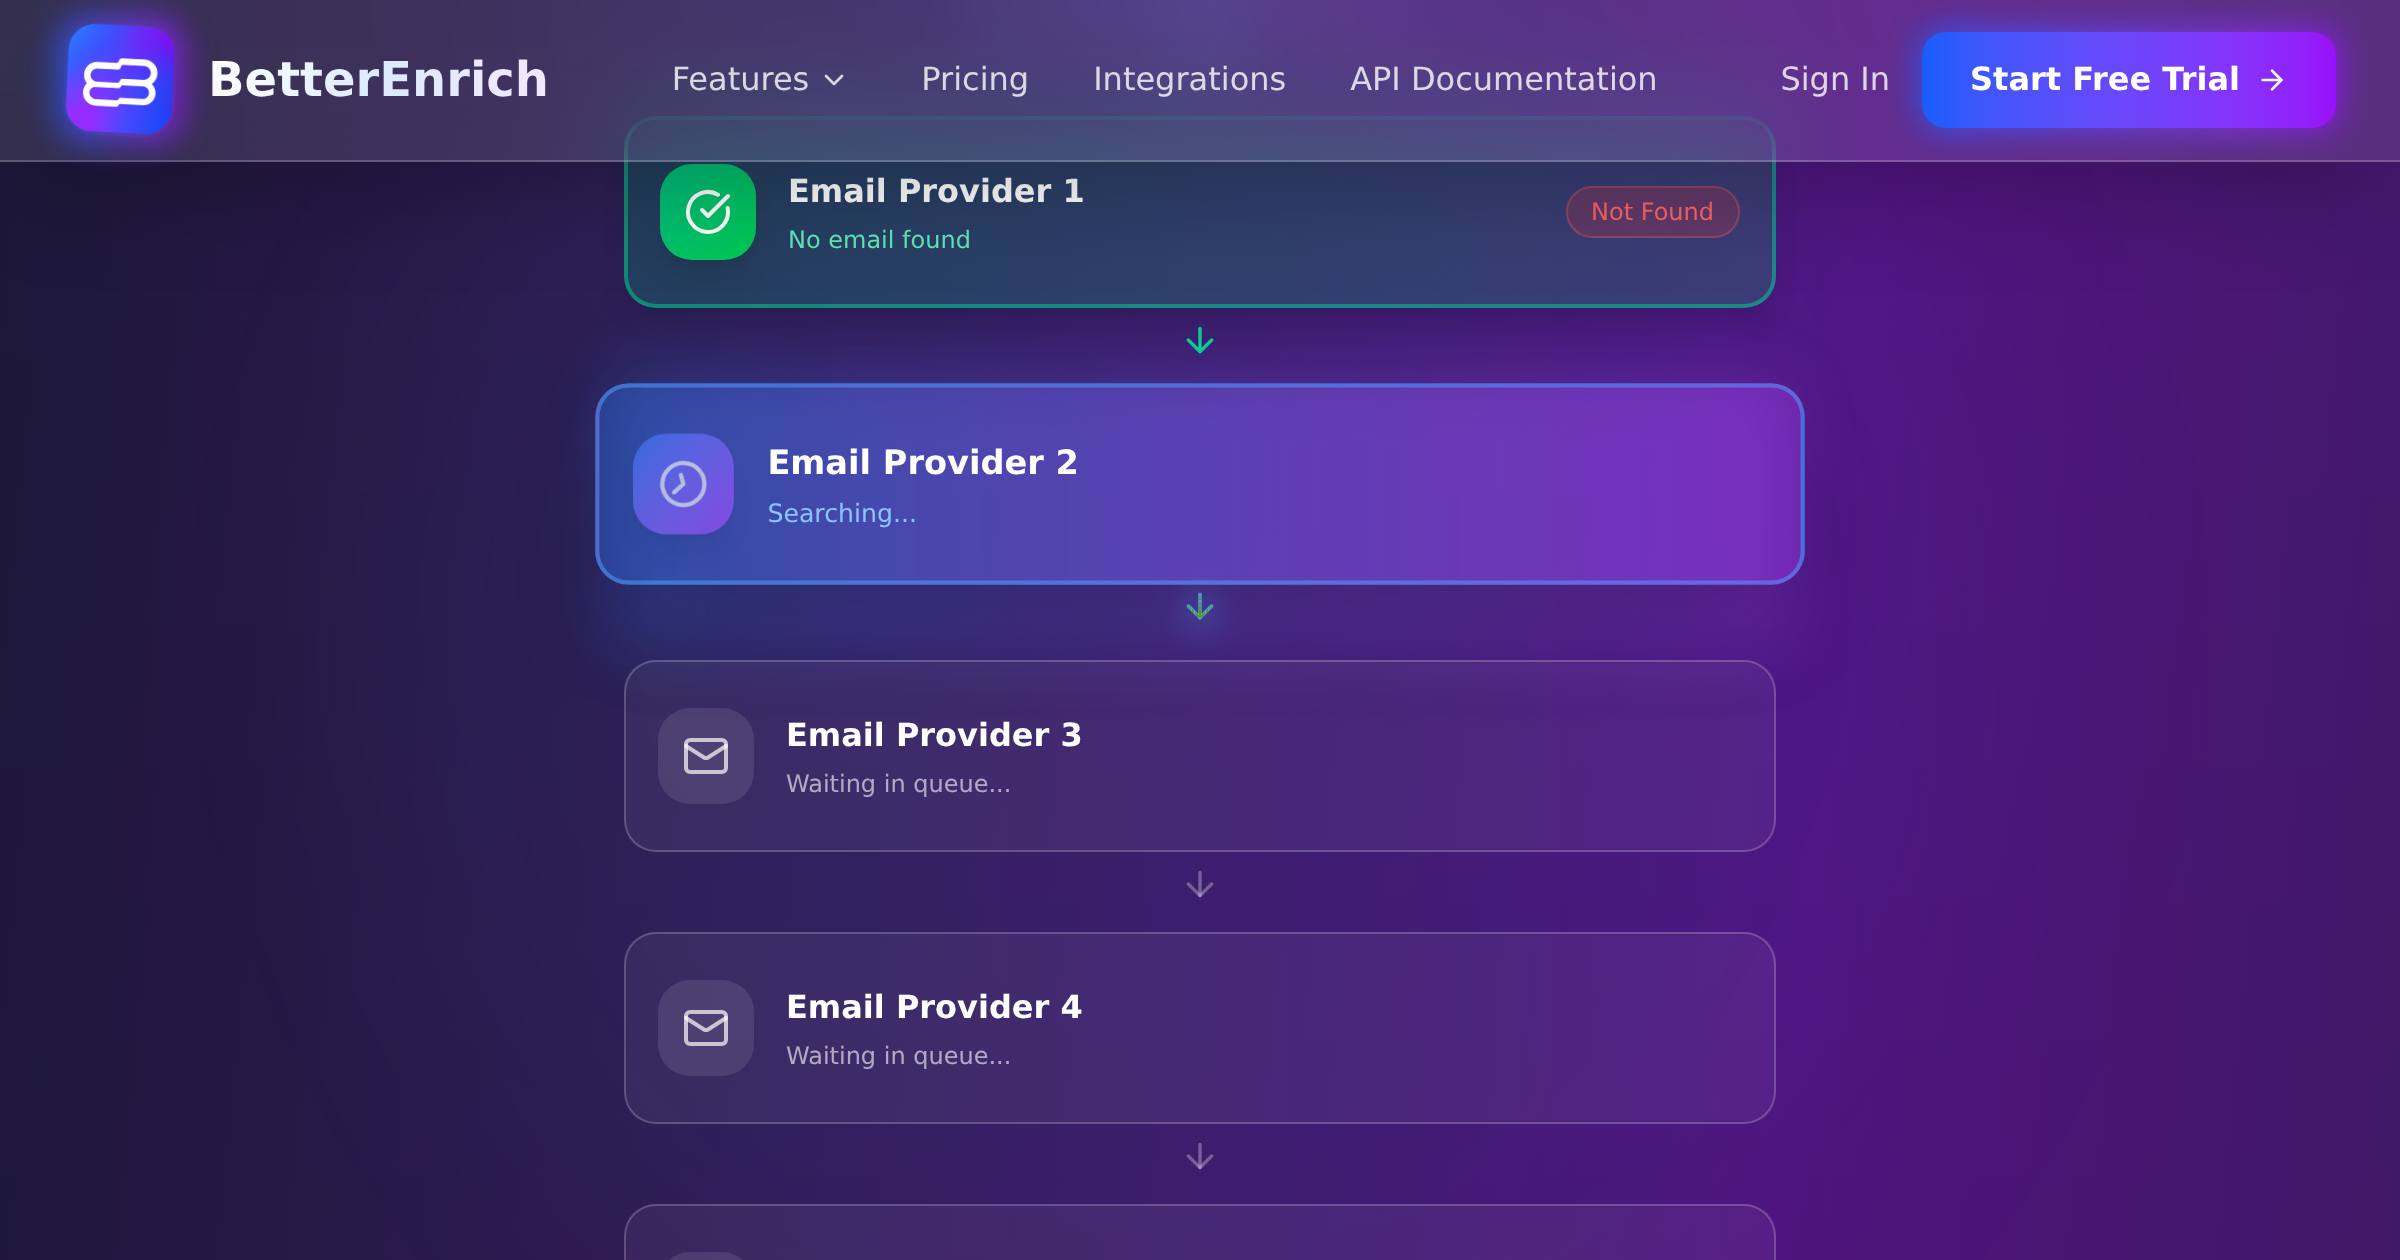
This is where waterfall enrichment pays dividends. With 85-95% coverage from a platform like BetterEnrich, nearly every lead gets scored accurately. With a single-source tool at 50-70% coverage, a third of your leads are scored on incomplete data, which means bad routing decisions.
Step 5: Automate the Workflow
The scoring model should run automatically. When a new lead enters the CRM, enrichment triggers immediately, the scoring model runs on the enriched data, and the lead gets routed based on the score. No manual intervention.
Most CRMs support this with workflows or automation rules. HubSpot has lead scoring built in. Salesforce supports it via Einstein or custom formula fields. The enrichment data needs to flow in via API or middleware (Zapier, Make) so the scoring model has data to work with.
Advanced Scoring Techniques
Negative Scoring
Not every signal is positive. Subtract points for disqualifying attributes: competitor employee (-20), job seeker visiting careers page (-10), student email domain (-15), company outside serviceable geography (-5).
Negative scoring prevents your reps from wasting time on leads that look engaged but will never buy. A student who downloads every whitepaper might accumulate behavioral points, but the negative score from their .edu email domain correctly flags them as non-qualified.
Score Decay
Engagement fades. A lead who was highly active three months ago but has gone silent is not the same as one who was active last week. Implement score decay: reduce behavioral points by 10-20% per month of inactivity.
This keeps your hot lead queue genuinely hot, not cluttered with stale leads who happen to have accumulated points in the past.
Account-Level Scoring
For B2B, individual lead scores only tell part of the story. If three people from the same company are all showing engagement, that is a much stronger signal than one person at three different companies.
Implement account-level scoring that aggregates individual lead scores within the same company. When multiple contacts at an account are active, the account score reflects the collective interest of a buying committee, not just one curious individual.
Measuring Your Scoring Model
Track these metrics to validate that your model works:
- Do high-scoring leads convert at a higher rate? (They should, by at least 2x)
- Is the average deal size higher for high-scoring leads? (It should be)
- Are your reps spending more time on high-scoring leads? (Check activity data)
- What is the false positive rate? (Leads scored high that never convert)
- What is the false negative rate? (Leads scored low that do convert)
Lead enrichment drives 25% higher conversion rates and 15% lower customer acquisition costs. A well-built scoring model on top of enriched data amplifies both of those numbers because it ensures the leads with the highest conversion probability get the most attention.
Refreshing Your Model
B2B contact data decays at 2.1% per month. Job titles change for 65.8% of contacts within 12 months. Your scoring model needs fresh data to stay accurate.
Re-enrich your database quarterly at minimum. Re-validate scoring weights against recent win/loss data every quarter. Drop criteria that no longer correlate with wins and add new ones that emerge from your latest analysis.
The companies that treat lead scoring as a living system rather than a one-time project consistently outperform those that set it and forget it. Your ICP evolves, your market shifts, and your scoring model needs to keep up.